pearsonCorrelation
Returns the Pearson correlation coefficient, which measures the linear relationship between two series of numbers. A relationship is linear when a change in one series is associated with a proportional change in the other.
The returned coefficient is a number between 1 and -1. A coefficient close to 1 indicates very strong positive correlation between the two series, with the second series increasing with the first. A coefficient close to -1 indicates very strong negative correlation, with the second series decreasing when the first increases. A coefficient close to zero indicates very little correlation.
Parameters
SERIES 1 (list)
The first series of numbers. This must be a list or list-like object with three or more numbers.
SERIES 2 (list)
The second series of numbers. This must be a list or list-like object with three or more numbers.
Notes
If one series is longer than the other, the function truncates the longer series to ensure two series of equal length.
If one series contains a null value, the function ignores this null and its corresponding value in the other series.
Examples
Example 1 — Table data
Assume a "Describe the Table" project with this data:
Code | Month | Sales | SalesTarget | Profit | ProfitTarget | |
|---|---|---|---|---|---|---|
Row 1 | 1001 | January | 98,248.36 | 100,000.00 | 25,284.66 | 20,000.00 |
Row 2 | 1002 | February | 112,783.34 | 80,000.00 | 36,519.78 | 16,000.00 |
Row 3 | 1003 | March | 75,042.52 | 100,000.00 | 19,777.23 | 20,000.00 |
Row 4 | 1004 | April | 104,864.16 | 100,000.00 | 22,196.63 | 20,000.00 |
Row 5 | 1005 | May | 113,491.78 | 100,000.00 | 32,492.28 | 20,000.00 |
Row 6 | 1006 | June | 125, 863.59 | 120,000.00 | 45,387.35 | 24,000.00 |
Columns are list-like objects, so you can input one column variable to each parameter:
ATL in Script | Result | Notes |
|---|---|---|
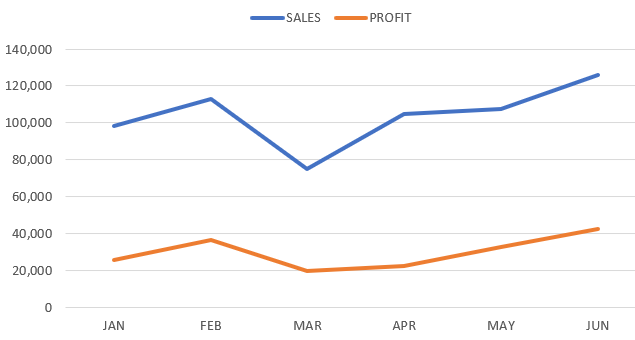
| 0.8712047 | The result indicates a strong linear relationship between Sales and Profit, with the second series increasing with the first. This linear relationship is visualized in the line graph below. |

Note
In a "Describe Row in Context" project, the column variables would be SalesColumn and ProfitColumn.
Example 2 — JSON data
Assume a "Describe a JSON Object" project with this data:
{
    "Finances": [
	{"month": "Jan", "sales": 10245.86, "cogs": 5000.00, "otherExp": 2500.00, "netProfit": 2745.86},
	{"month": "Feb", "sales": 10362.32, "cogs": 5500.00, "otherExp": 2500.00, "netProfit": 2362.32},
	{"month": "Mar", "sales": 10245.86, "cogs": 5600.00, "otherExp": 2500.00, "netProfit": 2145.86},
	{"month": "Apr", "sales": 10364.77, "cogs": 6000.00, "otherExp": 2500.00, "netProfit": 1864.77},
	{"month": "May", "sales": 10125.86, "cogs": 6500.00, "otherExp": 2625.00, "netProfit": 1000.86},
	{"month": "Jun", "sales": 10845.72, "cogs": 7000.00, "otherExp": 2625.00, "netProfit": 1220.72}
    ]
}
The Finances array contains six JSON objects, each containing five key–value pairs. Using this data, you can use pearsonCorrelation to investigate the relationship between COGS (Cost of Goods Sold) and Net Profit.
First, create the following user-defined variables:
Name | Type | Data Source | Printed Output |
|---|---|---|---|
COGS | LIST |
| 5,000.00, 5,500.00, 5,600.00, 6,000.00, 6,500.00 and 7,000.00 |
netProfit | LIST |
| 2,745.86, 2,362.32, 2,145.86, 1,864.77, 1,000.86 and 1,220.72 |
Second, input these variables to the pearsonCorrelation function.
ATL in Script | Result | Notes |
|---|---|---|
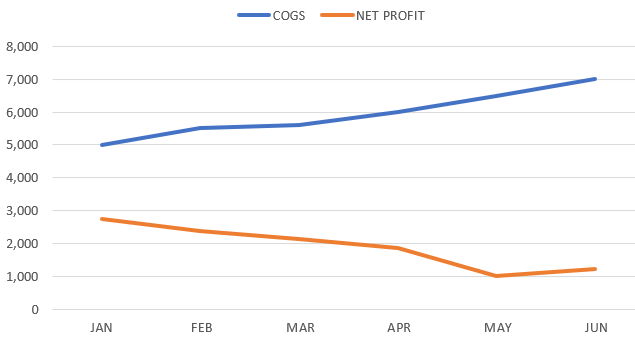
| -0.9461192 | The result is close to -1, which indicates a very strong linear relationship between COGS and Net Profit but with the latter decreasing when the former increases. See the line graph below. |

Here’s one way to use the calculated coefficient in a project. Assign the function result to a global variable, then use that variable in a multi-case conditional so the output varies depending on the coefficient value.
[[global.coeff = pearsonCorrelation(COGS,netProfit);'']]

[[if(coeff == -1.0){Increases in COGS correlated perfectly with decreases in Net Profit.}
elseif(coeff <= -0.9){Increases in COGS correlated very strongly with decreases in Net Profit.}
elseif(coeff <= -0.7){Increases in COGS correlated strongly with decreases in Net Profit.}
elseif(coeff <= -0.5){Increases in COGS correlated moderately with decreases in Net Profit.}
elseif(coeff <= -0.3){Increases in COGS correlated weakly with decreases in Net Profit.}
elseif(coeff == 1.0){Increases in COGS correlated perfectly with increases in Net Profit.}
elseif(coeff >= 0.9){Increases in COGS correlated very strongly with increases in Net Profit.}
elseif(coeff >= 0.7){Increases in COGS correlated strongly with increases in Net Profit.}
elseif(coeff >= 0.5){Increases in COGS correlated moderately with increases in Net Profit.}
elseif(coeff >= 0.3){Increases in COGS correlate weakly with increases in Net Profit.}
else{There was no correlation between COGS and Net Profit.}]]
The calculated coefficient is -0.9461192, so the output text is:
Increases in COGS correlated very strongly with decreases in Net Profit.
There might be some degree of positive correlation between COGS and Net Profit, so the conditional includes cases to cover these scenarios. For example, when the coefficient is 0.7293458, the output text is:
Increases in COGS correlated strongly with increases in Net Profit.