Minimum and maximum values
Next, we'll add sentences describing the largest and smallest states, both in terms of population and land mass. This part of the tutorial demonstrates how to use functions such as max, maxVal, min, minVal, cell, and rowNames.
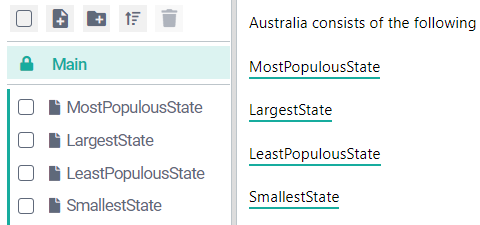
Click the Add New Script button and create four new subscripts: MostPopulousState, LargestState, LeastPopulousState, and SmallestState.
Add calls to these subscripts in the Main script:

Go to the MostPopulousState script and add the following text: The most populous state is A, with a population in 2016 of B, or C% of the country as a whole. Its total land mass is D square kilometers, which is E% of Australia’s total.

Let's start with placeholder A. To get the name of the most populous state, we need to find the cell in our table that contains the largest value for StatePop2016, then get the name of the row in which that cell resides.
Replace A with the StatePop2016 variable, select that variable, then click Insert Function > data access > max. This will open the Function Builder with
maxalready selected in the FUNCTION field and[[StatePop2016]]already selected in the REGION field.Click Save, then select the inserted function call.

Click Insert Function > data access > rowNames, then click Save.

Important
We have used the
maxfunction to identify the cell with the highest StatePop2016 value, then used therowNamesfunction to return the name of the row in which that cell resides.If there were multiple rows containing the maximum value for StatePop2016 then this composite function would return a list of row names. However, that is not the case here.
Next, we need to replace B with a function call that returns the maximum value for the StatePop2016 variable.
Replace B with the StatePop2016 variable, then apply the
maxValfunction (click Insert Function > math > maxVal) to the variable.
Important
It's worth pausing here to consider the distinction between
maxandmaxVal(and, similarly, betweenminandminVal).maxValreturns the actual value in the cell in question, whereasmaxreturns a table region that contains this single cell. You need the latter if you want to determine what row that cell is present in. This is why we usedmaxin steps 4–6 above. A combination ofmaxValandrowNameswouldn't work.Next, we want to replace C with a function call that calculates this state's population as a percentage of the country's population as a whole. We will do this with the
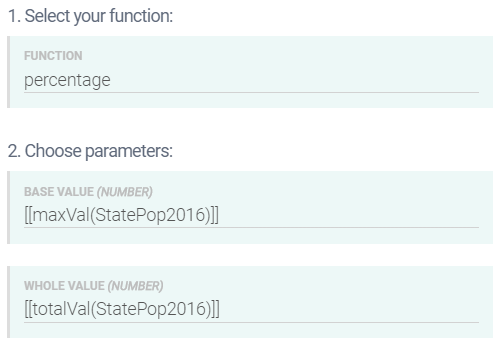
percentagefunction.Select C, then click Insert Function > math > percentage. This will open the Function Builder.
Populate the BASE VALUE and WHOLE VALUE fields as shown below, then click Save.

Your script show now look like this:

Note
At this level of complexity — that is, when you are inputting two function calls to the parameters of another function — it's often easier to switch to ATL View and write the composite function directly in ATL.
The ATL for our latest function call is:
[[percentage(maxVal(StatePop2016),totalVal(StatePop2016))]]Next we need to replace D with a function call that returns the land mass value for the most populated state. This is more complex because we must get the name of the row that contains the highest StatePop2016 value, then find the StateLandArea value for that row. We will do this with the
cellfunction.Copy (Ctrl + C) the first function call in your script.
We already have a function call for finding the row with the highest StatePop2016 value, so we can reuse it.
Paste the copied function call in place of D, then select it.

Click Insert Function > data access > cell. This will open the Function Builder with
[[rowNames(max(StatePop2016))]]already in the ROW NAME field.Select StateLandArea from the COLUMN field's drop-down, then click Save.
Your script should now look like this:

Now that we have the required land mass value, we need to replace E with a function call that calculates this land mass value as a percentage of the country's land mass overall. We can do this by applying the
percentagefunction to the last function call we created.Copy (Ctrl + C) the last function call, then paste it in place of E.

Select the pasted function call, then click Insert Function > math > percentage. This will open the Function Builder with
[[cell(rowNames(max(StatePop2016)),StateLandArea)]]already in the BASE VALUE field.Enter
[[totalVal(StateLandArea)]]in the WHOLE VALUE field, then click Save.
Click Preview. Your narrative should appear as:
The most populous state is New South Wales, with a population in 2016 of 7,618,200, or 32.03% of the country as a whole. Its total land mass is 800,641 square kilometers, which is 10.41% of Australia’s total.
Now, using what you've learned, try to produce the three remaining subscripts yourself. The end goal is to create a project that produces this text when you preview the Main script:
Australia consists of eight states and territories: New South Wales, Victoria, Queensland, Western Australia, South Australia, Tasmania, the Australian Capital Territory and the Northern Territory. It has a total population of 23,782,300 and a total land mass of 7,691,949 square kilometers.
The most populous state is New South Wales, with a population in 2016 of 7,618,200, or 32.03% of the country as a whole. Its total land mass is 800,641 square kilometers, which is 10.41% of Australia’s total.
The largest state is Western Australia, at 2,529,875 square kilometers; this is 32.89% of Australia's total land mass. The population of Western Australia is 2,591,600, which is 10.9% of Australia's total.
The least populous state is the Northern Territory, with a population in 2016 of 244,600, or 1.03% of the country as a whole. Its total land mass is 1,349,129 square kilometers, which is 17.54% of Australia's total.
The smallest state is the Australian Capital Territory, at 2,358 square kilometers; this is 0.03% of Australia's total land mass. The population of the Australian Capital Territory is 395,200, which is 1.66% of Australia's total.
We have provided the ATL for these subscripts below, but try to construct them without looking ahead.
ATL for LargestState script
The largest state is [[rowNames(max(StateLandArea))]], at [[maxVal(StateLandArea)]] square kilometers; this is [[percentage(maxVal(StateLandArea),totalVal(StateLandArea))]]% of Australia's total land mass. The population of [[rowNames(max(StateLandArea))]] is [[cell(rowNames(max(StateLandArea)),"StatePop2016")]], which is [[percentage(cell(rowNames(max(StateLandArea)),"StatePop2016"),totalVal(StatePop2016))]]% of Australia's total.
ATL for LeastPopulousState script
The least populous state is [[rowNames(min(StatePop2016))]], with a population in 2016 of [[minVal(StatePop2016)]], or [[percentage(cell(rowNames(min(StatePop2016)),"StatePop2016"),totalVal(StatePop2016))]]% of the country as a whole. Its total land mass is [[cell(rowNames(min(StatePop2016)),StateLandArea)]] square kilometers, which is [[percentage(cell(rowNames(min(StatePop2016)),"StateLandArea"),totalVal(StateLandArea))]]% of Australia's total.
ATL for SmallestState script
The smallest state is [[rowNames(min(StateLandArea))]], at [[minVal(StateLandArea)]] square kilometers; this is [[percentage(minVal(StateLandArea),totalVal(StateLandArea))]]% of Australia's total land mass. The population of [[rowNames(min(StateLandArea))]] is [[cell(rowNames(min(StateLandArea)),"StatePop2016")]], which is [[percentage(cell(rowNames(min(StateLandArea)),"StatePop2016"),totalVal(StatePop2016))]]% of Australia's total.
Congratulations! You’re done.
The next tutorial covers the "Describe Row in Context" project, which is the third and final project type that uses table data.