Identifying properties of a focus row
The main advantage of this project type is the ability to contextualize row-specific data by referring to data from outside the focus row. Studio creates two variables for each column in your dataset: one that produces the column value for the focus row only, and one that returns all column values. In this part of the tutorial, we'll use this data access mechanism to develop a script that identifies what makes the current state distinctive with respect to the others.
Add the following sentences to the State subscript:
This makes X the most populous state in the country.
This makes X the least populous state in the country.
The makes X the largest state in the country.
This makes X the smallest state in the country.
Replace each X placeholder with a call to the FocusRowName variable.

We only want these sentences to appear in our output narrative when they are in fact true; therefore, we must make their appearance conditional on the data.
Select the "most populous" sentence, then click Insert Conditional.

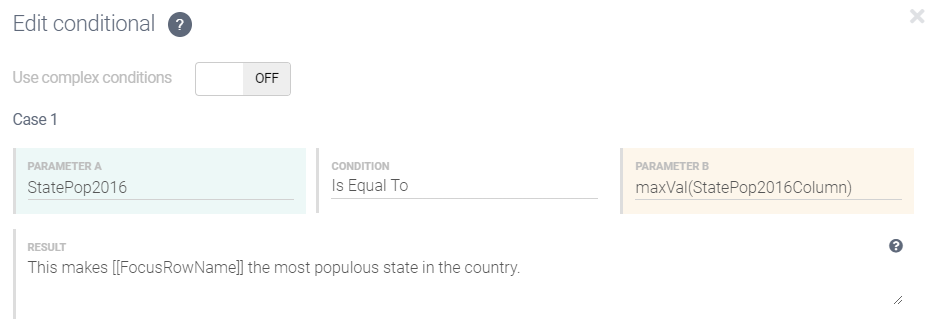
To test whether this sentence is true, we must ask if the StatePop2016 value for this row (the focus row) is equal to the maximum value in the whole StatePop2016 column.
Enter this comparison as the condition for CASE 1:

Important
An important, and unique, feature of this project type is that Studio creates two variables for every table column. It is important to understand the difference between them.
StatePop2016 is used in PARAMETER A because it returns the data value for the focus row only. All we need for this part of the comparison is a single value, and we can retrieve it using this variable.
The value we need for PARAMETER B is the highest data value in the entire StatePop2016 column. To compute this we must apply the
maxValfunction to the entire column, and this requires use of StatePop2016Column.Click Build to insert the conditional.
Note
This conditional does not require a CASE 2. Also, the DEFAULT RESULT field should be empty because we want Studio to return an empty string (i.e. nothing) when the CASE 1 condition is not true.
When entered correctly, the conditional is displayed in the Marked Up view underlined in purple:

Repeat steps 3–5 for the other three conditional sentences. Be careful to select suitable variables and to use
minValinstead ofmaxValwhen required. Once done, your script should look like this:
The underlying ATL (which can be seen in the editor's ATL View) for the four conditionals should be:
[[if(StatePop2016==maxVal(StatePop2016Column)){This makes [[FocusRowName]] the most populous state in the country.}]][[if(StatePop2016==minVal(StatePop2016Column)){This makes [[FocusRowName]] the most populous state in the country.}]][[if(StateLandArea==maxVal(StateLandAreaColumn)){This makes [[FocusRowName]] the largest state in the country.}]][[if(StateLandArea==minVal(StateLandAreaColumn)){This makes [[FocusRowName]] the largest state in the country.}]]Remove the line breaks so that the sentences form a single paragraph:

Preview each row of the data. The output for Row 1 should be:
New South Wales has a land mass of 800,641 square kilometers and a population in 2016 of 7,618,200, which is 5.24% up on 2010's figure of 7,238,800. This makes New South Wales the most populous state in the country.
Now let's produce a similar script for describing each state's capital city.
Go to the CapitalCity subscript and add this text:
In 2016, the capital city, A, had a population of B, which was C% up on 2010's count of D. This means E is the most populous state capital in Australia. This means F is the least populous state capital in Australia.

Complete the subscript, replacing the placeholders with the required variables, function calls, and conditionals. You can do this using the techniques used to build the State subscript, so this is left as an exercise.
Once done, the CapitalCity subscript should look like this:

The underlying ATL for this script is:
In 2016, the capital city, [[Capital]], had a population of [[CapitalPop2016]], which was [[percentageChange(CapitalPop2016,CapitalPop2010)]]% up on 2010's count of [[CapitalPop2010]]. [[if(CapitalPop2016==maxVal(CapitalPop2016Column)){This means [[Capital]] is the most populous state capital in Australia.}]] [[if(CapitalPop2016==minVal(CapitalPop2016Column)){This means [[Capital]] is the least populous state capital in Australia.}]]Return to the Main script and preview your narrative. The output for Row 1 should be:
New South Wales has a land mass of 800,641 square kilometers and a population in 2016 of 7,618,200, which is 5.24% up on 2010's figure of 7,238,800. This makes New South Wales the most populous state in the country.
In 2016, the capital city, Sydney, had a population of 4,526,479, which was 8.2% up on 2010's count of 4,183,471. This means Sydney is the most populous state capital in Australia.
Congratulations! You now know how to create projects that use table data in three different ways.
You can also create a project using data in JSON format. This is covered in the Describing a JSON object tutorial.