Inserting functions
Before inserting functions, let's extend the content of the narrative and add some more variables. The variables we’ll add are similar to the one we added in Inserting variables.
Delete the existing text in the script.
Copy and paste the following text into the script:
Jurisdiction has a land mass of StateLandArea square kilometers and a population in 2016 of StatePop2016, up from 2010's figure of StatePop2010. The capital city, Capital, has a population of CapitalPop2016, which is up from 2010's count of CapitalPop2010.
Tip
When working through the tutorials, it is best to activate Plain Paste Mode before pasting text copied from another web page (such as this one!). This ensures that the copied text is pasted into the script editor as plain text, i.e. with any HTML formatting removed. See Formatted Paste Mode or Plain Paste Mode.
Now replace the appropriate words with the relevant variables. Once done, your script should look like this:

Inserting a function to add a computed value to the narrative
Next, you’ll see how you can add computed values into the text. So far, the text says that the population has gone up in both the jurisdiction and in its capital. (Of course, the populations could also have gone down. You’ll see how to deal with that later.)
But you might want to know by how much the population has increased in each case. In particular, you might want to say what the percentage change is between 2010 and 2016. To work this out, you’ll make use of a function. ATL functions compute new pieces of information on the basis of information provided in your data.
Position the cursor between up and from in the first sentence of your script. This is where you’ll insert your function.
Click the Insert Function button (third in the top row). This will drop down the Function Builder menu.
Select math > percentageChange.
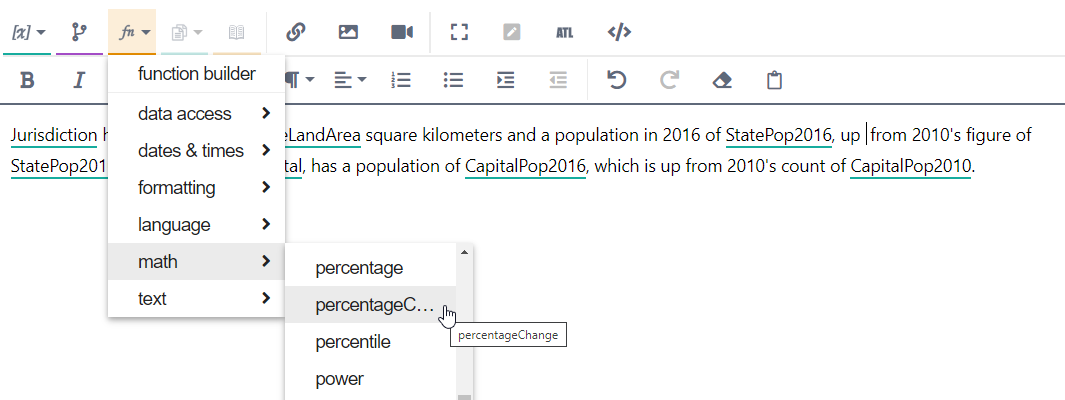
This opens the Function Builder dialog:
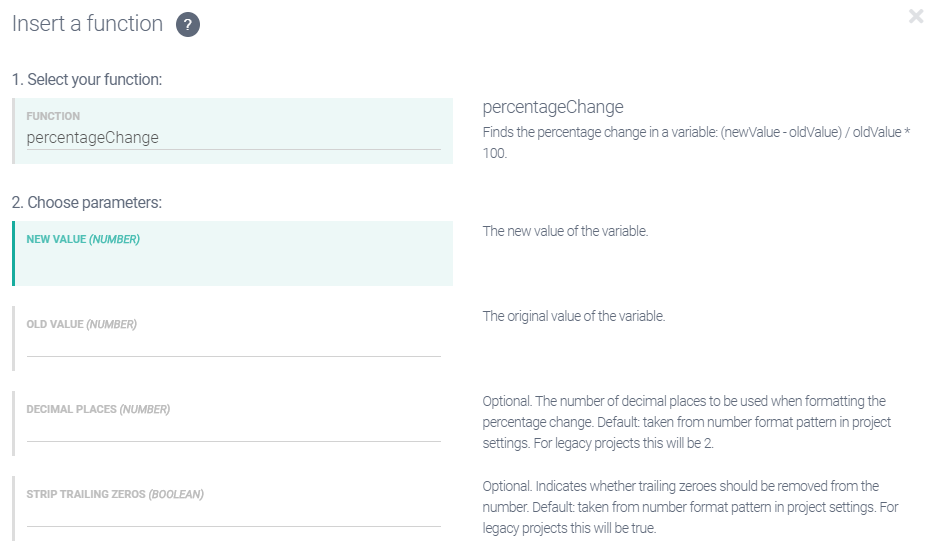
The FUNCTION field at the top is already populated because you selected the function from the Function Builder menu. Below are further fields for each of the parameters that the function takes. The names and descriptions of those parameters will depend on the specific function you are using.
Often the value you want to use is one of the variables corresponding to the columns in your data table; therefore, as soon as you click on a parameter field, a drop-down menu will appear with the names of the available variables.
Click in the NEW VALUE field and select StatePop2016 from the drop-down.
Click in the OLD VALUE field and select StatePop2010.
Click in the DECIMAL PLACES field and enter 1.
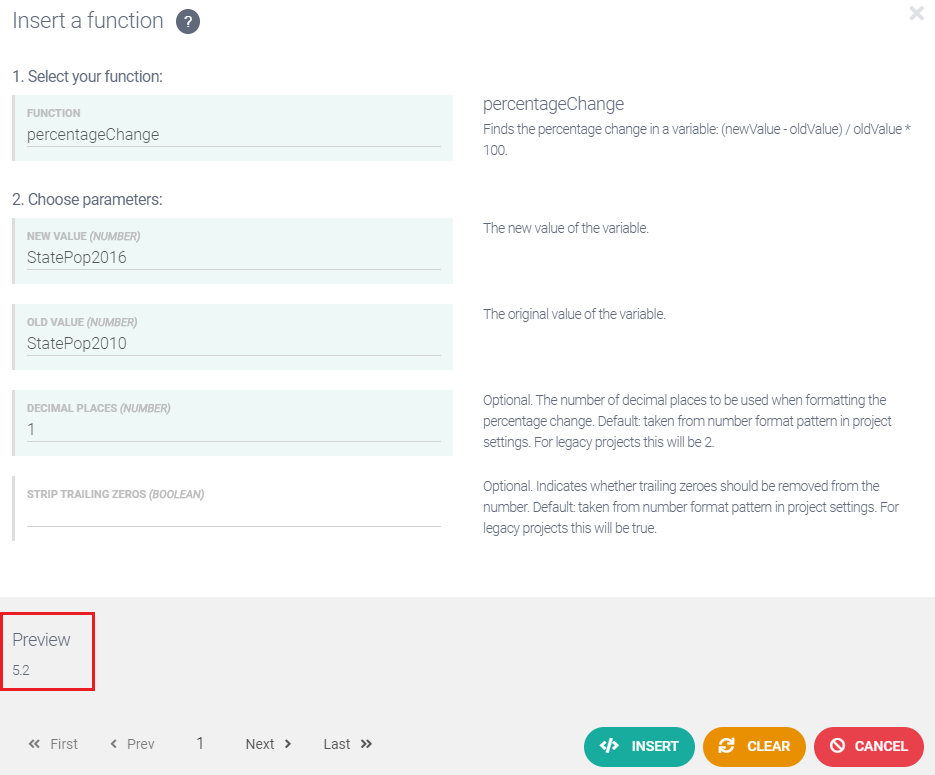
You'll notice that the Function Builder has its own local preview mode at the bottom of the dialog. Here you can navigate through your data rows to make sure the values being computed by the function make sense.
Click the Insert button to insert the function into your script. Once added, your script should look like this:

Important
Studio shows function references underlined in orange when the editor is in Marked Up View.
If you decide you want to change the function call — say, for example, you now wanted to change the number of decimal places — just double-click the function name where it appears in the script and the Function Builder dialog will re-open, allowing you to edit the function call’s parameters.
Now add a second call to the
percentageChangefunction to indicate the extent to which the capital city’s population has changed. Insert the function between up and from in the second sentence of your script.The parameter values for this second function call are:
NEW VALUE: CapitalPop2016
OLD VALUE: CapitalPop2010
DECIMAL PLACES: 1
Once added, your script should look like this:

Add "%" at the end of each function call.

Note
The
percentageChangefunction simply returns a number; it doesn’t append the number with a percentage symbol, so you have to add that yourself. This gives you the flexibility of presenting the fact that this is a percentage in any way you choose, such as using the word percent.
Selecting text to replace with a function
Above, you inserted function calls at a cursor location, but you can also replace a piece of selected text with a function call.
Add the following text to your script: Today the capital is home to X% of the state's population.

Here we want to indicate which proportion of a jurisdiction's population resides in the capital city. To do this, we have to compute the jurisdiction's population as a percentage of the state's population.
Using our data variables, the calculation is: (CapitalPop2016 x 100) / StatePop2016. We can perform the first part of this calculation (the multiplication) using the
productfunction, and then perform the second part (the division) using thedivfunction.Click and drag to select the X in your script, then click Insert Function > math > product
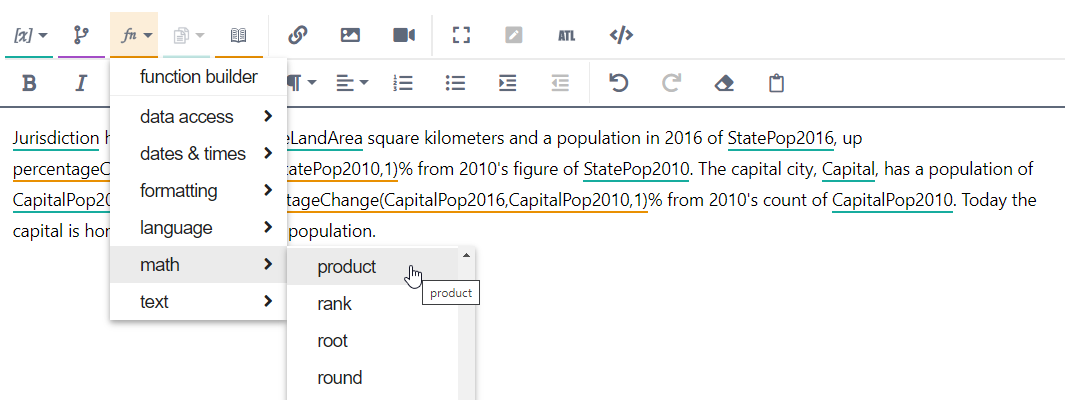
In the Function Builder dialog, delete the X from the X field (first parameter) and select CapitalPop2016 from the drop-down.
Enter 100 in the Y field (second parameter).
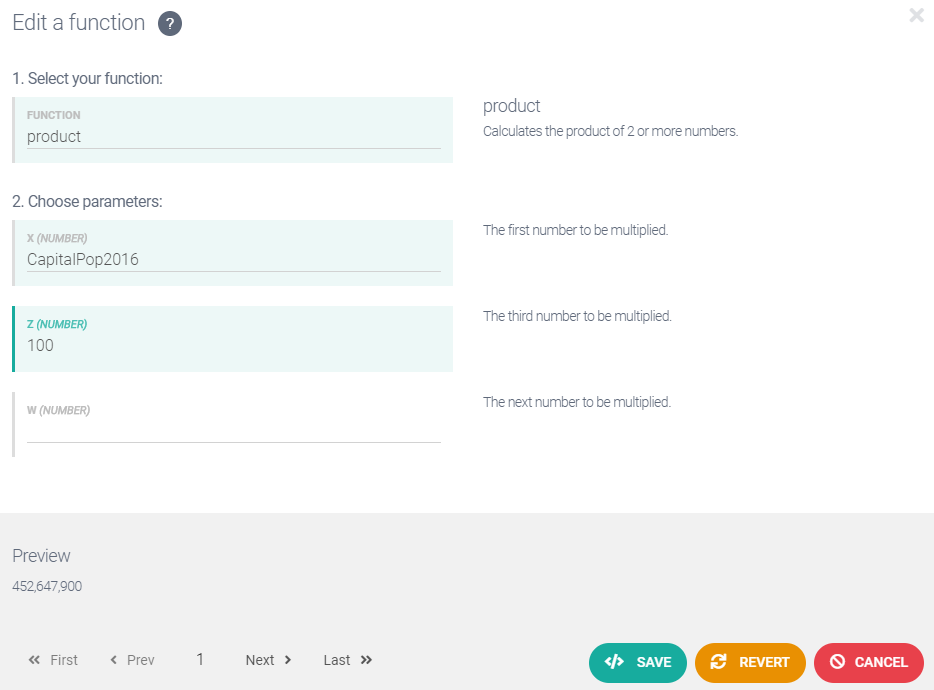
Click Save to insert the function into the script. Your script should now look like this:

Click once on the newly inserted function call to select it (it will turn grey), then click Insert Function > math > div.
The Function Builder dialog appears again, this time with the FUNCTION field populated with div, and the DIVIDEND field populated with [[product(CapitalPop2016,100)]].
Click in the DIVISOR field and select StatePop2016 from the drop-down.
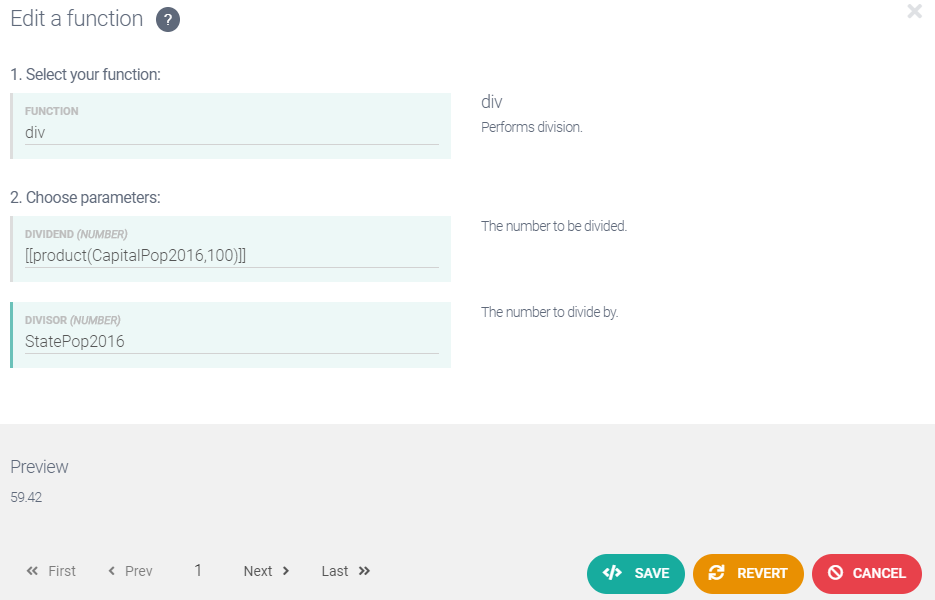
Click Save. Your script should now look like this:

Click Preview. The output text for Row 1 should be:
New South Wales has a land mass of 800,641 square kilometers and a population in 2016 of 7,618,200, up 5.2% from 2010’s figure of 7,238,800. The capital city, Sydney, has a population of 4,526,479, which is up 8.2% from 2010’s count of 4,183,471. Today the capital is home to 59.42% of the state’s population.
Formatting functions
There is a small inconsistency in how percentage values are displayed in the output text. Specifically, the first two percentage values are displayed to one decimal place whereas the third is displayed to two decimal places.
The first two percentage values are the results from calls to the percentageChange function. These are displayed to one decimal place because you specified this (using the function's DECIMAL PLACES parameter) when building the calls. You were unable to do the same for the third percentage value because it's the result from a call to the div function, which doesn't have a DECIMAL PLACES parameter.
To display the third percentage value to one decimal place, let's use another function.
Click once on the last function call to select it (it will turn grey), then click Insert Function > formatting > precision.
The Function Builder dialog opens, this time with the FUNCTION field populated with precision, and the VALUE field populated with [[div(product(CapitalPop2016,100),StatePop2016)]].
Click in the DECIMAL PLACES field and enter 1.
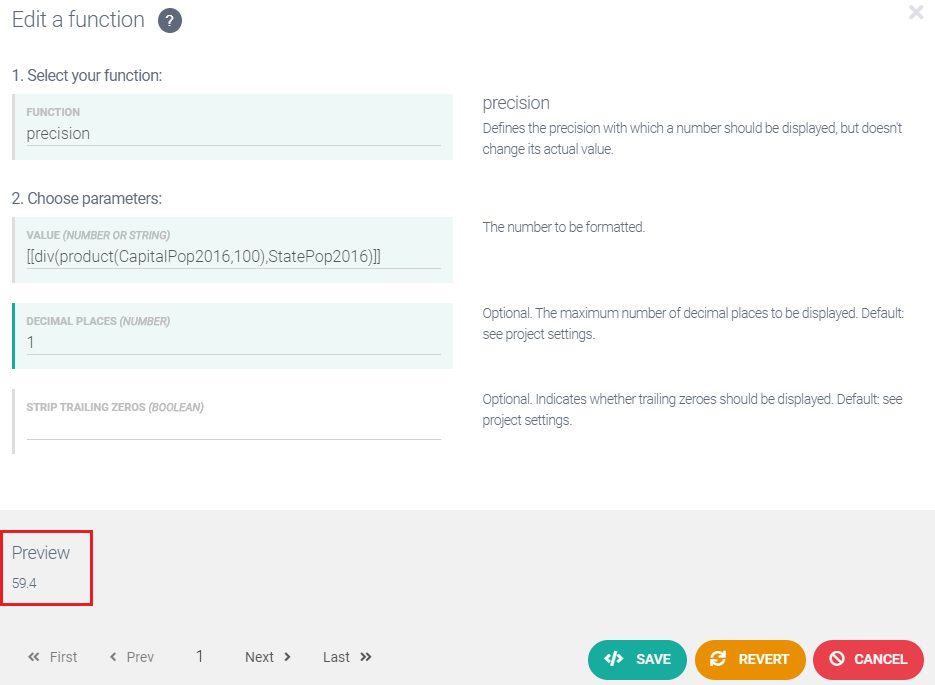
Click Save. Your script should now look like this:

Click Preview. The output text for Row 1 should be:
New South Wales has a land mass of 800,641 square kilometers and a population in 2016 of 7,618,200, up 5.2% from 2010’s figure of 7,238,800. The capital city, Sydney, has a population of 4,526,479, which is up 8.2% from 2010’s count of 4,183,471. Today the capital is home to 59.4% of the state’s population.
Next step: Creating new variables