Using data values in your text
Let’s start small. Right now, let’s look at the simplest way of presenting text. We know that our data is about sales activities. What pieces of the data do we want to draw into our narrative? Let’s start by outlining some information we want to report — for example, sales totals for a certain time frame.
Below the Monthly Sales title, type the following: This report covers sales in X.
We’ll replace the X later with a time frame.
Note
We have added X as a placeholder. To add author insights, NLG Studio can do many sophisticated things beyond filling in placeholders. But for now, we are eliminating the complexity as we explain the basics.
The rest of this topic is organized as follows:
Working with ATL
To put data into our narrative, we’re going to use ATL, which is short for Articulate Text Language. ATL is the language Arria NLG has constructed to make writing complex narratives easy. To write in ATL, you place double square brackets around items. The simplest piece of ATL is a set of square brackets around the name of a variable. In a JSON project, we start with one variable: WholeJSON.
In your script, in the line beginning This report covers sales in…, replace the X with
[[WholeJSON]].Note
We advise that you activate Plain Paste Mode before pasting text copied from this website (such as the ATL above). See Formatted Paste Mode or Plain Paste Mode for further details.
Click Preview and see what happens.

The result is the text report, followed by your entire JSON object. That’s not very useful. This narrative definitely needs more work.
What we want to do in this tutorial is describe sales for a particular month; this information is stored in
monthinside the JSON object. We can use dot notation to select values from inside the JSON.Click Done, or click somewhere off the Preview Mode overlay, to return to the Compose view.
Change
[[WholeJSON]]to[[WholeJSON.month]].Click Preview and take a look at the result.

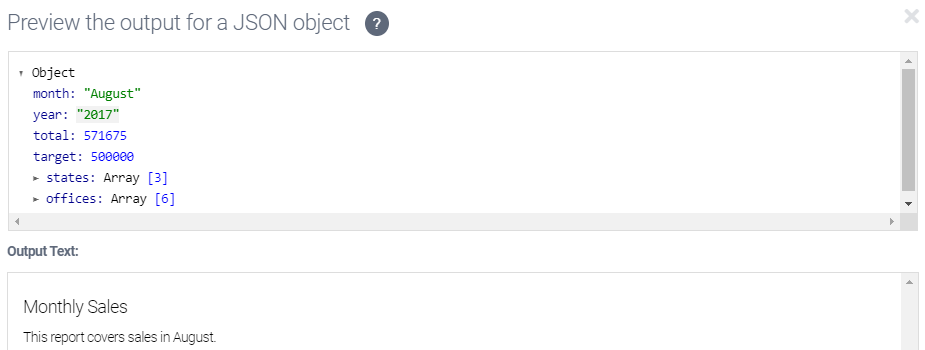
Because we added the
monthproperty to theWholeJSONvariable, the report now talks about sales for the month of August.Click Done, or click somewhere off the Preview overlay, to return to the Compose view.
Just for fun, let’s change the data for the month variable and see the difference in the report.
In the left of the screen, click Data to get to the Data view.
In the editing pane on the left, change
month: "August"tomonth: "November".Click Preview to see what that change does to the report.
The narrative now reports on sales in November.
Return to the Data view and change
Novemberback toAugust.Now go back to the Compose view.
Let’s add some more specificity to our narrative.
Continue the first sentence of your script with the value of the
yearproperty. This needs to be in a separate ATL snippet from themonthproperty.This report covers sales in [[WholeJSON.month]] [[WholeJSON.year]].You can also reference JSON data using brackets notation. This would look like:
This report covers sales in [[WholeJSON['month']]] [[WholeJSON['year']]].You can choose to use either dot notation or brackets notation. This tutorial will use dot notation.
Click Preview.
You should see that the report is now about sales for August 2017.
Now let’s specify where the sales took place. Add another ATL snippet using the
statesproperty so that your first sentence now reads:This report covers sales in [[WholeJSON.month]] [[WholeJSON.year]] in [[WholeJSON.states]].Check in the Data view — what value does
stateshold?In fact,
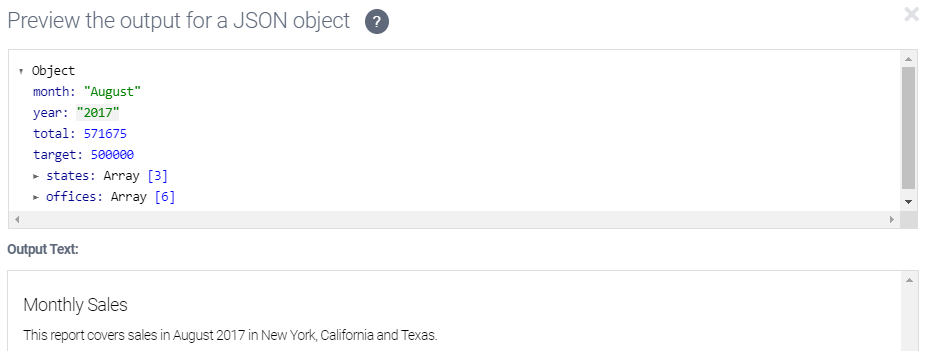
statesis not a single value, but rather a list (a JSON array). NLG Studio can handle lists for you and present them sensibly to the reader.Click Preview.
The output for
statesis “New York, California and Texas.”
Manipulating data with functions
So far, we have directly substituted values from our JSON into our text. You’ll find, however, that you often need to manipulate these values into a format that is more suitable for your narrative.
We want to add a total sales figure into our narrative.
In the script editor, below the content already there, type: Total sales were Y across the month.
Y is going to be a dollar amount.
Replace Y with
[[WholeJSON.total]].Click Preview.
You should see: Total sales were 571,675 across the month.
Okay. But 571,675 what? We need to use an ATL function to tell us which currency we’re talking about. ATL functions are methods that take a number of arguments, perform an action, and return the result. The
currencyFormatfunction will take a number and format it as a currency expression.The top bar in the script editor contains buttons for the NLG Studio-specific functionality, such as the ability to insert commonly used functions.

Highlight
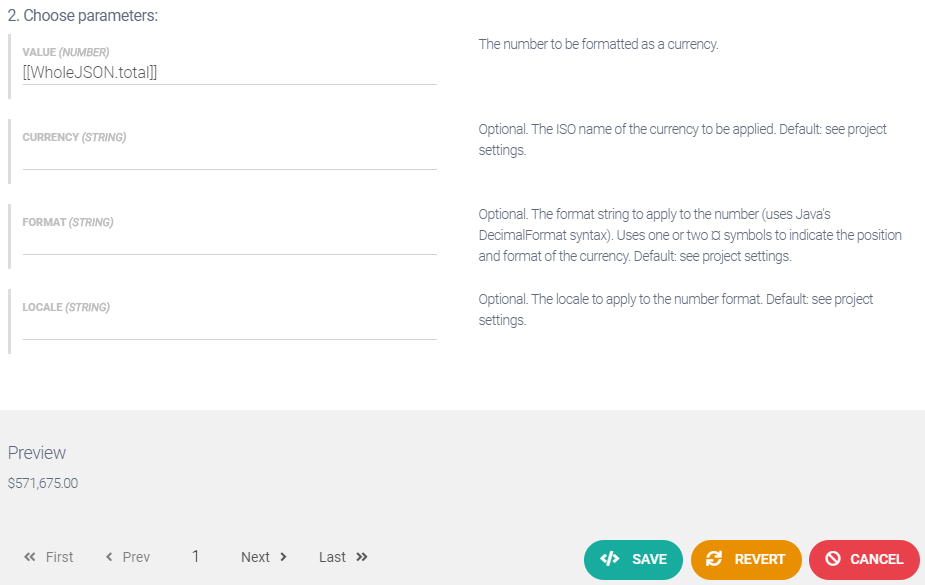
[[WholeJSON.total]]in your script, click the Insert Function button (fn), then choose formatting > currencyFormat.This opens the Function Builder dialog with the
currencyFormatfunction already selected. The Function Builder shows all of the parameters for this function, most of which are optional. Because you highlighted[[WholeJSON.total]]before choosing the function, it is[[WholeJSON.total]]that appears as the input to the first parameter.Note: If you didn’t select
[[WholeJSON.total]]before choosing thecurrencyFormatfunction, you can type that in now.Look at the bottom of the Function Builder dialog (you may need to scroll down) to see a preview of the function output. This will change to reflect the choices you make using the function's optional parameters. At this point, the output should be displayed as $571,675.00.

Right now the currency value is displayed to two decimal places with trailing zeros included. We can change this using the optional FORMAT parameter.
Click in the FORMAT field and select ¤#,### from the drop-down.
This format pattern strips the trailing zeros and makes the number an integer. You should now see as the output as $571,675.
Note
See currencyFormat for more about currency format patterns.
Click Save. The ATL for this function now appears in your script. The ATL looks like this:
[[currencyFormat(WholeJSON.total,'','¤#,###')]]Now let’s extend our narrative to describe how actual sales compare to target sales.
In the script editor, change the second sentence so that it ends with , which is X% of our target. The X is our placeholder for the number we are going to use with the
percentagefunction.
This time, let’s write our function in pure ATL. We need to call the
percentagefunction. with the argumentsWholeJSON.totalandWholeJSON.target.In place of X, type (or paste in) the following:
[[percentage(WholeJSON.total,WholeJSON.target,'')]]Note
In Step 8 you typed the % character after the X. This is because the
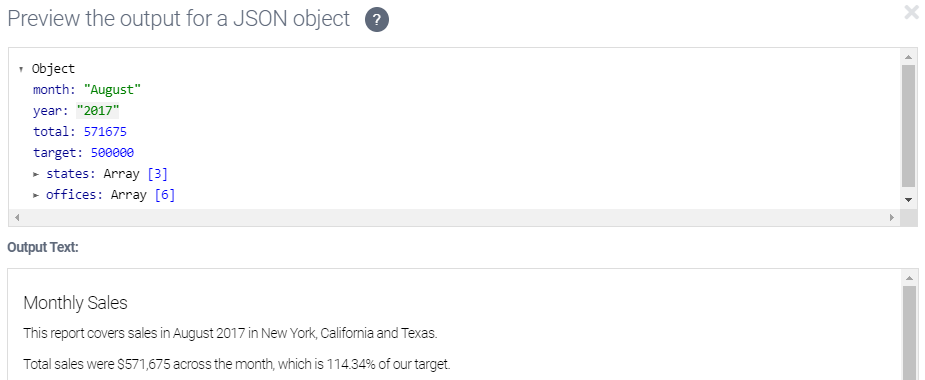
percentagefunction. returns a calculated percentage but does not automatically add a % character. The function works this way so that you have the flexibility to display the percentage figure in the way you want.Click Preview.
The output should report that total sales were 114.34% of the target.

Okay, our narrative is taking shape. We’ve done a lot in this step of the tutorial. We’ve added a variable (WholeJSON), we’ve gotten a brief introduction to ATL, and we’ve used dot notation to select values from our JSON data. We’ve also directly edited our sample data in the left pane of the Data view. We’ve seen a JSON array output as a list, we’ve applied a function (currencyFormat) format some of our output, and we’ve applied another function (percentage) to manipulate our data.
Next, we’ll see how useful it can be to add subscripts under the Main script.