Describing a whole table
This tutorial covers the Describe the Table project type. This project type should be used when you have a multi-row table of data and wish to generate a single story. This project type is color-coded purple.
The tutorial is organized as follows:
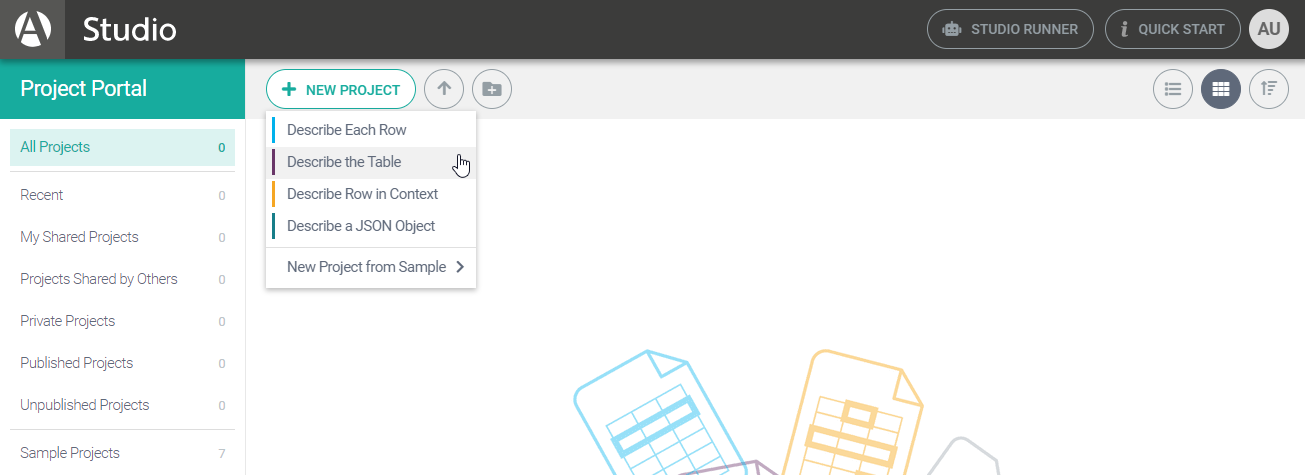
In the portal, click the New Project button and select Describe the Table from the drop-down menu:
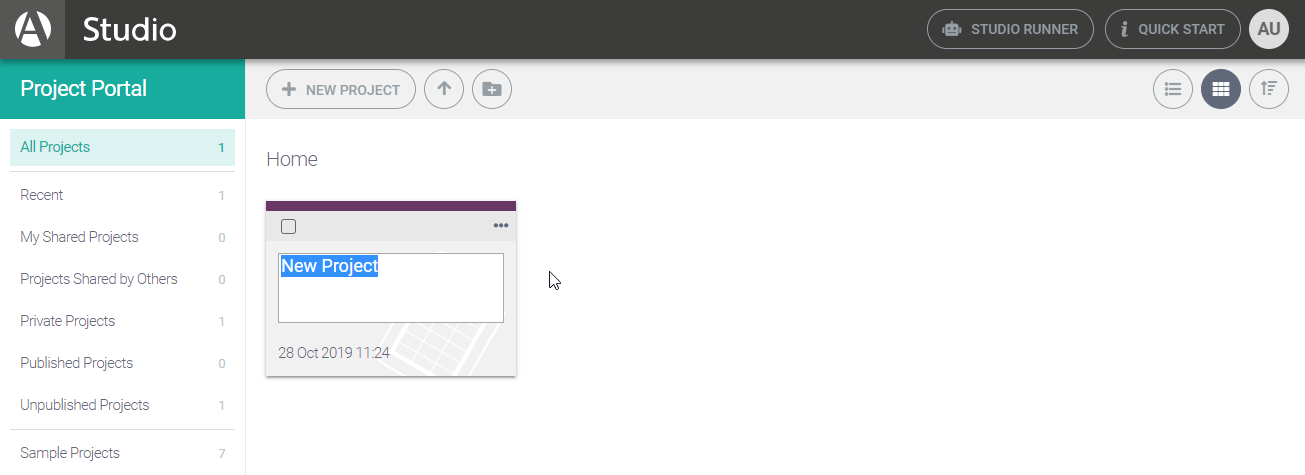
Give your project a name. We are going to use the same data as we did for the previous tutorial, but this time we will describe the whole country represented by that data.
Next, we’ll start working with table rows and columns.
