Working with a focus row
"Describe Row in Context" projects generate a separate narrative for each row in your data table. In this respect, they are similar to "Describe Each Row" projects, which we covered in the first tutorial.
The important difference is that "Describe Row in Context" projects allow you to construct a narrative that refers to data from outside the focus row (i.e. the row for which the narrative is being generated). This requires a more complex data access mechanism.
This first part of the tutorial, however, covers working with a focus row.
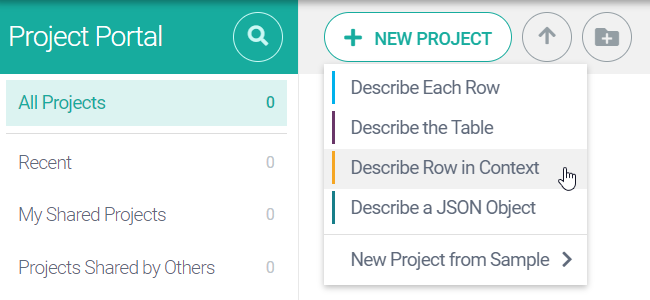
Go to the Project Portal and click New Project > Describe Row in Context.

Name your project to your liking.
Import the CSV data file (AustralianStates.csv).
Important
This tutorial uses the same dataset used for the "Describe Each Row" tutorial. If you don’t have the CSV data file saved to your local drive, you can download it again by clicking HERE.
Click Compose.
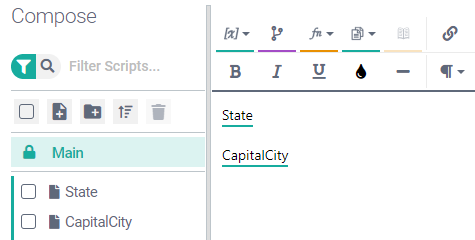
Our narrative is going to have two paragraphs: one that describes the state, and another that describes the capital of that state.
Create two subscripts, State and CapitalCity, then insert calls to these subscripts in the Main script:

Go to the State subscript and add the following text: A has a land mass of B square kilometers and a population in 2016 of C, which is D% up on 2010's figure of E.

The first task is to replace A with a variable that returns the name of the state/territory. This information is contained in our data table's first column, which in this project type is the row names column. We need the row name for the focus row, and this is retrieved using a special variable called FocusRowName.
Select A, click Insert Variable, then select FocusRowName from the drop-down.

Note
The FocusRowName variable is unique to this project type.
Next, we need to replace B with a variable that will return the land mass value for the focus row.
Select B, click Insert Variable, then select StateLandArea from the drop-down.

Important
The drop-down includes two similarly named variables: StateLandArea and StateLandAreaColumn. Both variables correspond to our data table's StateLandArea column; however, they return different data.
At this particular stage of the tutorial, we need only the StateLandArea value for the focus row; therefore, we use the StateLandArea variable. If we used the StateLandAreaColumn variable instead, we would get a punctuated list of every value in the column. We will make use of this option later in the tutorial.
Replace C and E with the relevant variables.

Note
Again, we must use StatePop2016 and StatePop2010, rather than StatePop2016Column and StatePop2010Column, because we want data values for the focus row only.
Next, we'll replace D with a call to the
percentageChangefunction:Select D and then click Insert Function > math > percentageChange. This opens the Function Builder with the
percentageChangefunction already selected.Select
StatePop2016in the NEW VALUE field andStatePop2010in the OLD VALUE field, then click Save.
Click Preview. Your output text for Row 1 should be:
New South Wales has a land mass of 800,641 square kilometers and a population in 2016 of 7,618,200, which is 5.24% up on 2010's figure of 7,238,800.
You can preview the narrative for other rows using the navigation buttons. These should be familiar from the tutorial for "Describe Each Row" projects.
So far the "Describe Row in Context" project may be difficult to distinguish from the "Describe Each Row" project. All we have done is build a simple script that uses variables and functions to retrieve or calculate data values particular to the focus row.
The next part of the tutorial will demonstrate how to create more sophisticated narratives by using data from outside the focus row.